UW PCE Digital Marketing Analytics Certification Program
The University of Washington’s PCE (Professional & Continuing Education) Digital Marketing Analytics Certificate course is broken into 3 components over 3 quarters, essentially the same as a year in college and tuition plus fees were $1044 per quarter:
- Marketing Data Landscape & Tools
- Digital Marketing Measurement Methods
- Drawing Insight from Data
The students were employees of companies investing in their digital marketing knowledge and skills those acquiring a deeper knowledge of digital marketing on their own. Most were adding skills to ensure better opportunities.
This is the first of 3 blog posts, one for each quarter. This post will cover the first quarter with a bit of program orientation. The program was designed so students would “gain conceptual understanding of how key marketing systems function and interact at a technical level and the type of data they produce.”
UW PCE DIG ANA 100 Quarter 1 — Marketing Data Landscape & Tools
12 Thursdays, 6:00 – 9:00PM, Sep 25 to Dec 11, 2014

Scott Fasser
fasser@u.washington.edu
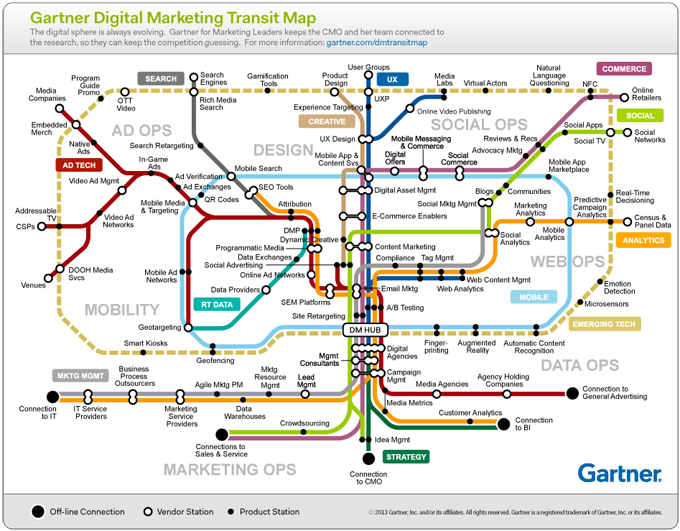
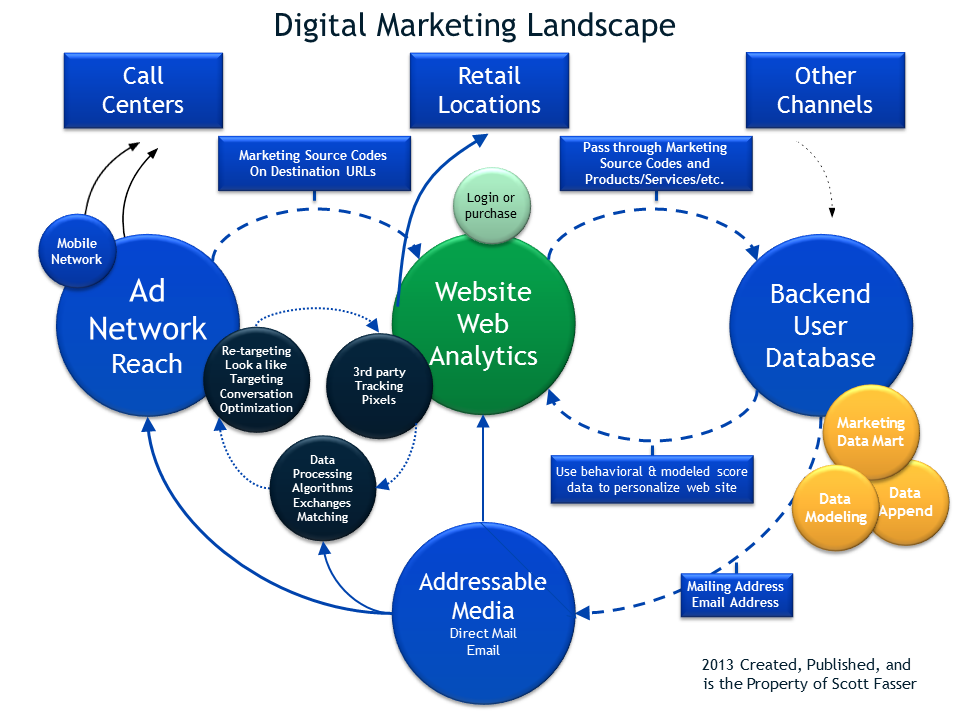
The theme of the first quarter’s class, taught by Scott Fasser, Hacker Agency, is to restate the course names, Digital Marketing Landscape. Scott presented at the February Seattle Search Network Meetup and as comprehensive as Scott’s presentation was in February, it was no match for the quality and quantity of information that was provided in the class room. There were many models and diagrams but there were two diagrams and one tool that best framed the world of digital marketing:
- The Gartner Digital Marketing Transit Map, which details the interactions between activities, tools, and data across business functions
- The Digital Marketing Landscape, created by Scott Fasser in 2013, was used all three quarters, providing a GPS location as we moved through the curriculum
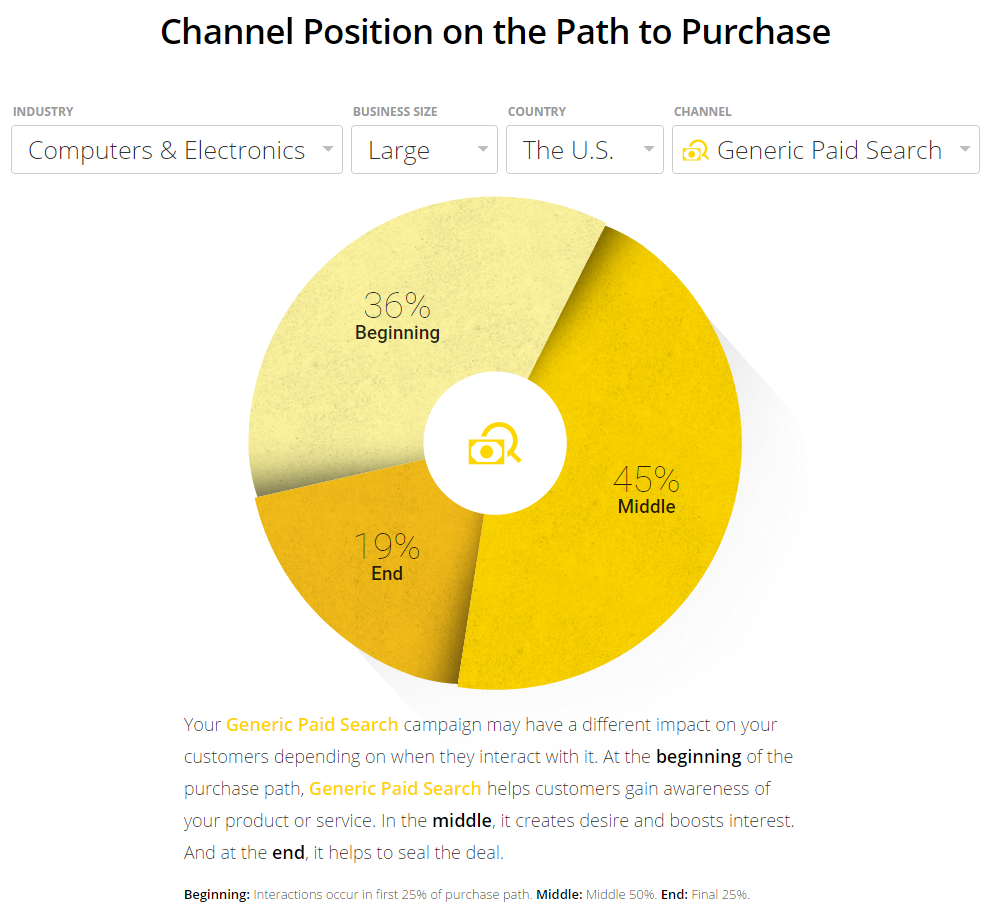
- The Think with Google Customer Journey to Online Purchase tool which identifies which alignment of marketing channels works best for specific markets.

The quarter began with the basics and broadly covered the following systems in the subsequent classes:
- Introduction to Digital Data & Systems
- How Websites Work & Introduction to Web Analytics
- Free Data – Google Analytics – Advanced
- Ad Serving Technologies & Systems
- The Secret of Search – Organic and Paid
- It Just Works – Email – Database, Delivery, Readers
- Revenue Machine – CRM and Backend Systems
- The Internet of Things – Mobile/Connected Devices
- Tools of the Trade – Excel and SQL
- Next Level Data – Social Media
But to always comes back to why is the data important to the business, the measurements, and the KPIs.
Session 1 introduced the concepts of combining data from cookes, IP addresses, IMEA, and social logins that are being used to uniquely identify customers and purchases they are considering. And the the other side of the data what is PII and and an overview of the privacy laws. The homework included understand what identifiers the classmates were sharing and the most riveting was learning the Facebook terms of service.
Session 2 familiarized us with how content ends up on your webpage, which systems serve the content, the syntax of the Internet, domains, sub-domains and directories. This lead us to learn how to build a simple website, using General Assembly. Once the website was built it was time to learn how to we would apply analytics, but first we received the historical perspective of the technology and the players before we logged into Google Analytics and began exploring.
Session 3 provided a intensive overview of the Google Analytics tool. A guest lecturer, Caleb NNNN, demonstrated how to use the tool to analyize a website’s performance even when the exact report was in place. He was able to discern the last visit from customers and then set up a report that more explicitly showed the path that it took to that last visit.
Session 4 introduced the Think with Google Customer Journey tool pictured above. The focus of the session was the complex display media and the ad delivery networks, plus reporting using complex spreadsheets. It made it pretty clear that Google has a profound affect on Digital Marketing.
Session 5 covered how search works mechanically as well as how organic search and paid search are used. The class also received a large set of tools and websites beyond the tools supplied by Google.
Session 6 was all about mobile. Scott had just returned from the Direct Marketing Associate conference where he presented a new tool for better understanding, the full monty[1], the mobile card game. This session included a tremendous set of statistics about the mobile world.
[1] “gamblers’ jargon meaning the kitty or pot, deriving from the old US card game called monte,” Quinion, Michael, World Wide Words, The Full Monty,
Session 7 reinforced that email is still the top digital marketing channel and plays very important roles assisting a customer interactions as well as being the last interaction. It also is incorporated well in CRM systems. To support complete understanding there was a section that detailed the mechanics of creating, sending and delivering an email. It looks simple from afar but the journal involves multiple systems, vendors, and technologies.
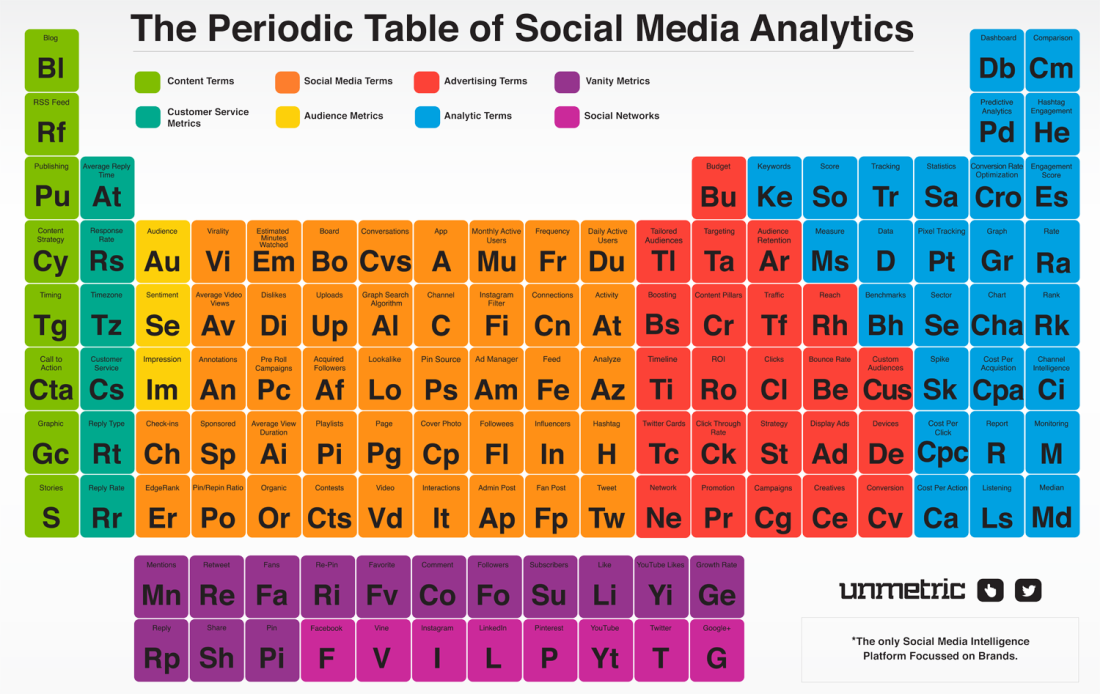
Session 8 dove into the world of social media. From its rise to prominence, its diverse community, the addition as an advertising platform, its digital identity mapping and finally analytics and the tools. And that is just the US which is dwarfed by the social media landscape in China. The tools available come from the media channels ala Google Analytics, and there are also tools that measure and report across channels as well as the evolution of CRM to Social CRM. And not the least, the periodic table.
Session 9 introduced more complex data types with a focus on SQL, Excel VLOOKUP and Pivot tables. It began with an overview of database basics amd evolved into the entities of a marketing database. The assignments had the class join tables, aggragate data from the tables and Excel spreadsheetz and finally use pivot tables to provide a marketing view of the data and the KPIs.
Session 10 introduced the use of analytics to research competitors. A list of favorite tools was provided such as compete.com, socialmention, MOAT, WhatRunsWhere, SpyFu, AdGooroo, Wordtracker, SEMRush, Google Crawler, Moz, OpenSiteExplorer.org (Moz.com), Majestic, CompereMedia, Email Insights, and finally signing up on the competitive sites newsletters. Then the class transitioned to inbound marketing and how it is about influencing the market with content in order to attact visitors to ones site. This was followed by conversion rate optimization (CRO) Optimizely, Visual Website Optimizer, Un-bounce, Test and Target, MEC Labs Converion Index[1] c=4m+3v+2(i-f)-2a, along with the rules of a value proposition[2]. Of course testing, establishing a benchmark and then testing advertisements, web content,and emails as a process rather than an event. An email messaging effectiveness index (eme)[3] was presented as an example of a way to create a KPI for measuring theeffectiveness of the content of an email. There was a lot covered in this session , but the take aways were, there is a lot of data for competitive analysis, inbound marketing is where marketing should begin, leading KPIs are important but more important are the productive KPIs. Testing is easy to talk about but to begin the journey start with Google Adwords and landing pages and build from there.
[1] MEC Labs Conversion Index components:
C = Probability of conversion
m = Motivation of user (when)
v = Clarity of the value proposition (why)
i = Incentive to take action
f = Friction elements of process
a = Anxiety about entering information
[2] Value Proposition Rules
- Clarity trumps persuasion
- Clearly distinguish your differences
- Why buy from you than anyone else?
- Examples of Clear Value Proposition
- The first, best or only
- We do this one thing better than any
[3] eme = rv (of + i) – (f + a)
eme = email messaging effectiveness index
rv = relevance to the consumer
of = offer value (why)
i = incentive to take action
f = friction elements of process
a = anxiety about entering information
Session 11 was the final session in the first quarter and focused on turning all of the data created during the previous weeks into understandable presentations. The basics were first, who is the audience, what is the right frequency as well as the level of detail. Tools such as Excel, Domo, Sparkpoint, and Rival IQ were reviewed. Rules of the road were also presented, because the presenting of findings should be done with high quality and care. And always when possible, provide visualizations.
Conclusion There was much ground covered about a variety of digital marketing channels and tools. This overview was important at this point of the total course. On one hand it was a serious volume of information that was a challenge to process and retain in a short time, but without learning the landscape it would have been more challenging as we did a deep dive in the following quarters. There will be two more quarters’ worth of posts coming around the corner.
Reading for the DMA100
- The Gartner Digital Transit Map — http://www.gartner.com/technology/research/digital-marketing/transit-map.jsp
- Facebook’s terms of service — https://www.facebook.com/legal/terms
- http://www.kaushik.net/avinash/biggest-web-analysts-mistake-how-to-avoid/
- http://www.socialmediaexaminer.com/metrics-to-track-your-social-media-efforts/
- https://blog.kissmetrics.com/7-essential-intelligence-events/
- Live Ramp Holiday Webinar — https://www.brighttalk.com/webcast/11557/120859
- Video — http://resources.spyfu.com/accurate-spyfu-data/
- VinConnect Case Study & Data Set
- API Video– https://www.youtube.com/watch?v=B9vPoCOP7oY
- Customer Touch Point Mapping – http://www.slideshare.net/TPDashboard/touchpoint-dashboard-journey-mapping-guide-2014, http://blogs.hbr.org/2010/11/using-customer-journey-maps-to/, http://www.heartofthecustomer.com/wp-content/uploads/2013/03/Customer-Journey-Map.png